Pipedrive Reporting That Powers Sales Results
Pipedrive Forecasting, Goal Tracking & Coaching Dashboards — all from your Pipedrive CRM data.

🚀 Why Dear Lucy + Pipedrive
Pipedrive helps you move deals through the pipeline. But when it comes to tracking progress, forecasting revenue, or driving team performance, the reporting can feel… limited.
That’s where Dear Lucy comes in.
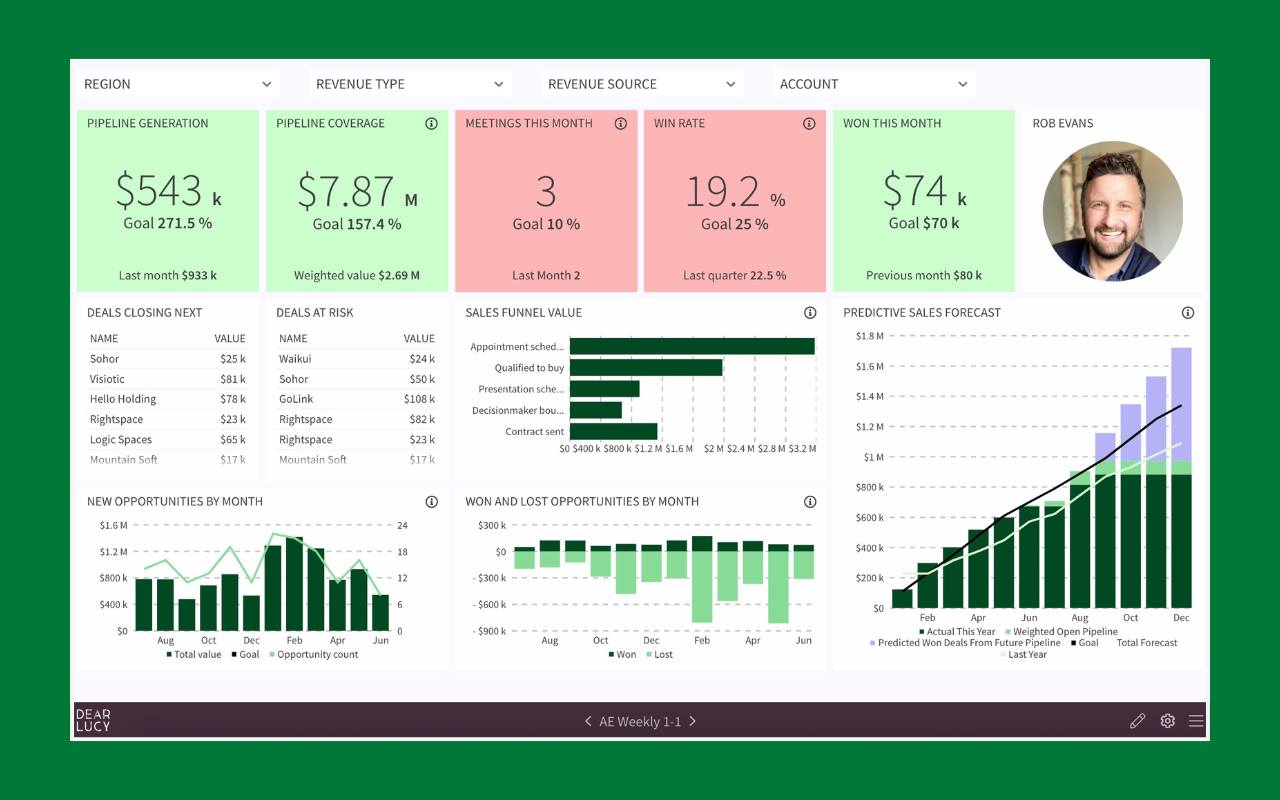
We transform your Pipedrive data into clear, actionable insights — no spreadsheets, no manual exports, no guesswork.

Built for Sales Teams Who’ve Outgrown Pipedrive Reporting
Dear Lucy gives you the next level of visibility — fast, flexible, and built for performance. Upgrade from basic Pipedrive reporting to dashboards that drive action.
Predictive forecasting based on real pipeline activity
Goal tracking by rep, team, market, or product line
Historical KPI trends and funnel analytics
MRR/ARR reporting for recurring revenue businesses
Pipeline hygiene dashboards (yes, with a Wall of Shame)
Leaderboards that spark friendly competition and accountability
Plug-and-play setup. Always up to date. 100% powered by your Pipedrive CRM.
🎯 Sales Goals That Actually Boost Your Sales
Set meaningful goals—and achieve them.
Define targets per rep, team, market, or product
Monitor real-time performance vs goals
Receive alerts when pacing lags
Spotlight and celebrate high performers
It’s the goal tracking in Pipedrive that users always wanted—finally done right.

📊 Sales KPIs with Historical Trends FOR PIPEDRIVE
Stop guessing—start understanding.
See pipeline value, win rates, velocity and activity trends over time
Zoom in or roll up by rep, team, product, market, or custom segments
Compare current performance to past periods at a glance
It’s KPI clarity with context—so your Pipedrive reporting dashboards tell the full story.

🔮 Pipedrive Forecasting You Can Trust
Trust your numbers again.
Smart deal scoring from 1–99% based on real pipeline behavior
Weighted pipeline models that reflect true momentum
Visibility into forecast vs actual performance
It’s Pipedrive forecasting you can bet on—built from real-time CRM data.

🧭 Pipeline Analytics that Drive Action
Know exactly where to act.
Visualize stage conversion, deal velocity, and time-in-stage
Detect stalled or stagnant deals
Surface activity-to-outcome correlation for smarter pipeline hygiene
It’s analytics that tell you where to intervene—so your Pipedrive pipeline actually performs.

📊 Recurring Revenue Reporting
Track your growth engine.
Automatically calculate MRR/ARR, churn, and upsell
Segment by product, contract type, or renewal period
See monthly and quarterly trends in one simple view
It’s recurring revenue visibility—designed for subscription, service, or product businesses using Pipedrive.
Trusted by Sales Teams and Pipedrive Power Users
⭐⭐⭐⭐⭐ Rated.
Plug-and-play for scaling sales teams who need more than basic reports.
🔗 See Dear Lucy on Pipedrive Marketplace
“Clear dashboards, quick insights — exactly what we were missing in Pipedrive.”
— Sales Manager, B2B Services
“Setup took minutes. Now our forecasts actually mean something.”
— Head of Sales Operations
Get tailored sales dashboards for every
level of your sales organization
Whether you need a high-level report or a
detailed drill-down, we’ve got you covered.

Board & management team
Make sales performance easy to understand and communicate — even across countries or business units. Use executive dashboards both during and in-between meetings to stay aligned on targets, risks, and upside.

Chief Revenue Officer (CRO)
See forecast accuracy, pipeline coverage, goal performance, and revenue risks across teams or regions — all in one view.

Sales Managers
Track team quota attainment, deal activity, CRM hygiene, and pipeline health to coach performance daily.

Sales Reps
Stay focused with dashboards that highlight your targets, pipeline, upcoming meetings, and deal priorities — all embedded where you already work.

Revenue Operations (RevOps)
Save time and headaches with dashboards that replace spreadsheet hacks and custom builds. Track pipeline health, CRM hygiene, goal progress, and team accountability — all with clean, up-to-date data.

